Visualise phenotype networks at scale
Explore real-world phenotype connections through intuitive, data-driven maps. Discover patterns across the UK Biobank cohort in seconds.
Unlock phenotype insights
A new way to explore complex data
Interactively map, filter, and extract high-impact signals from the UK Biobank’s phenotype graph with ease.
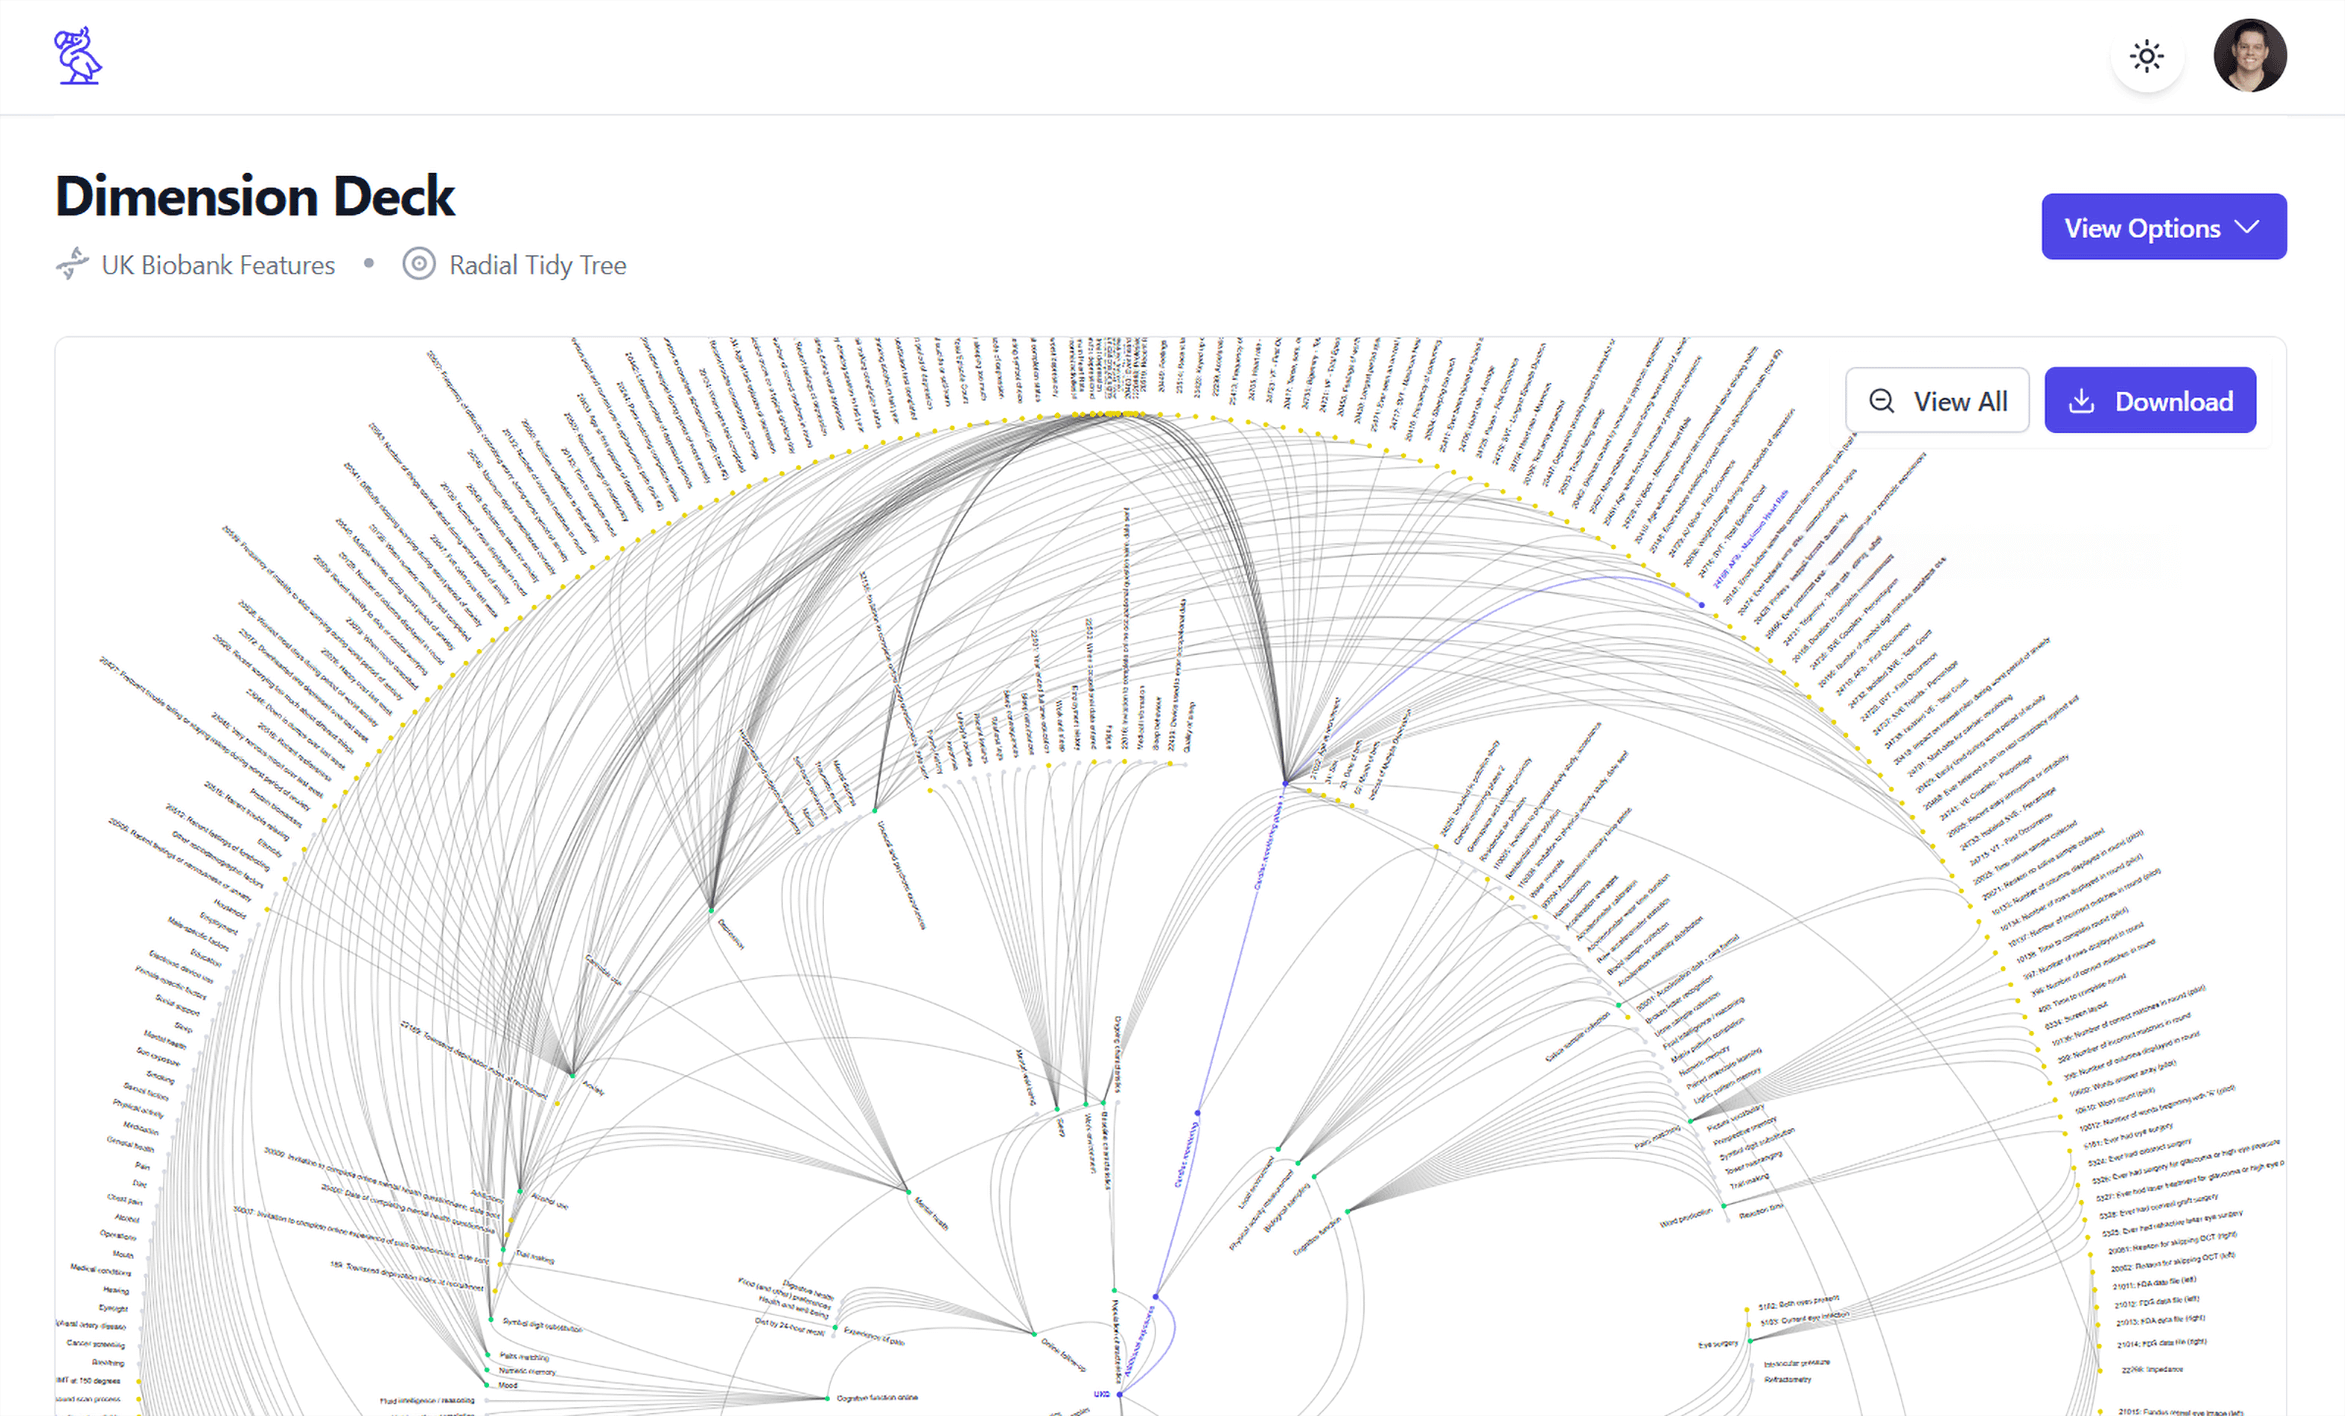
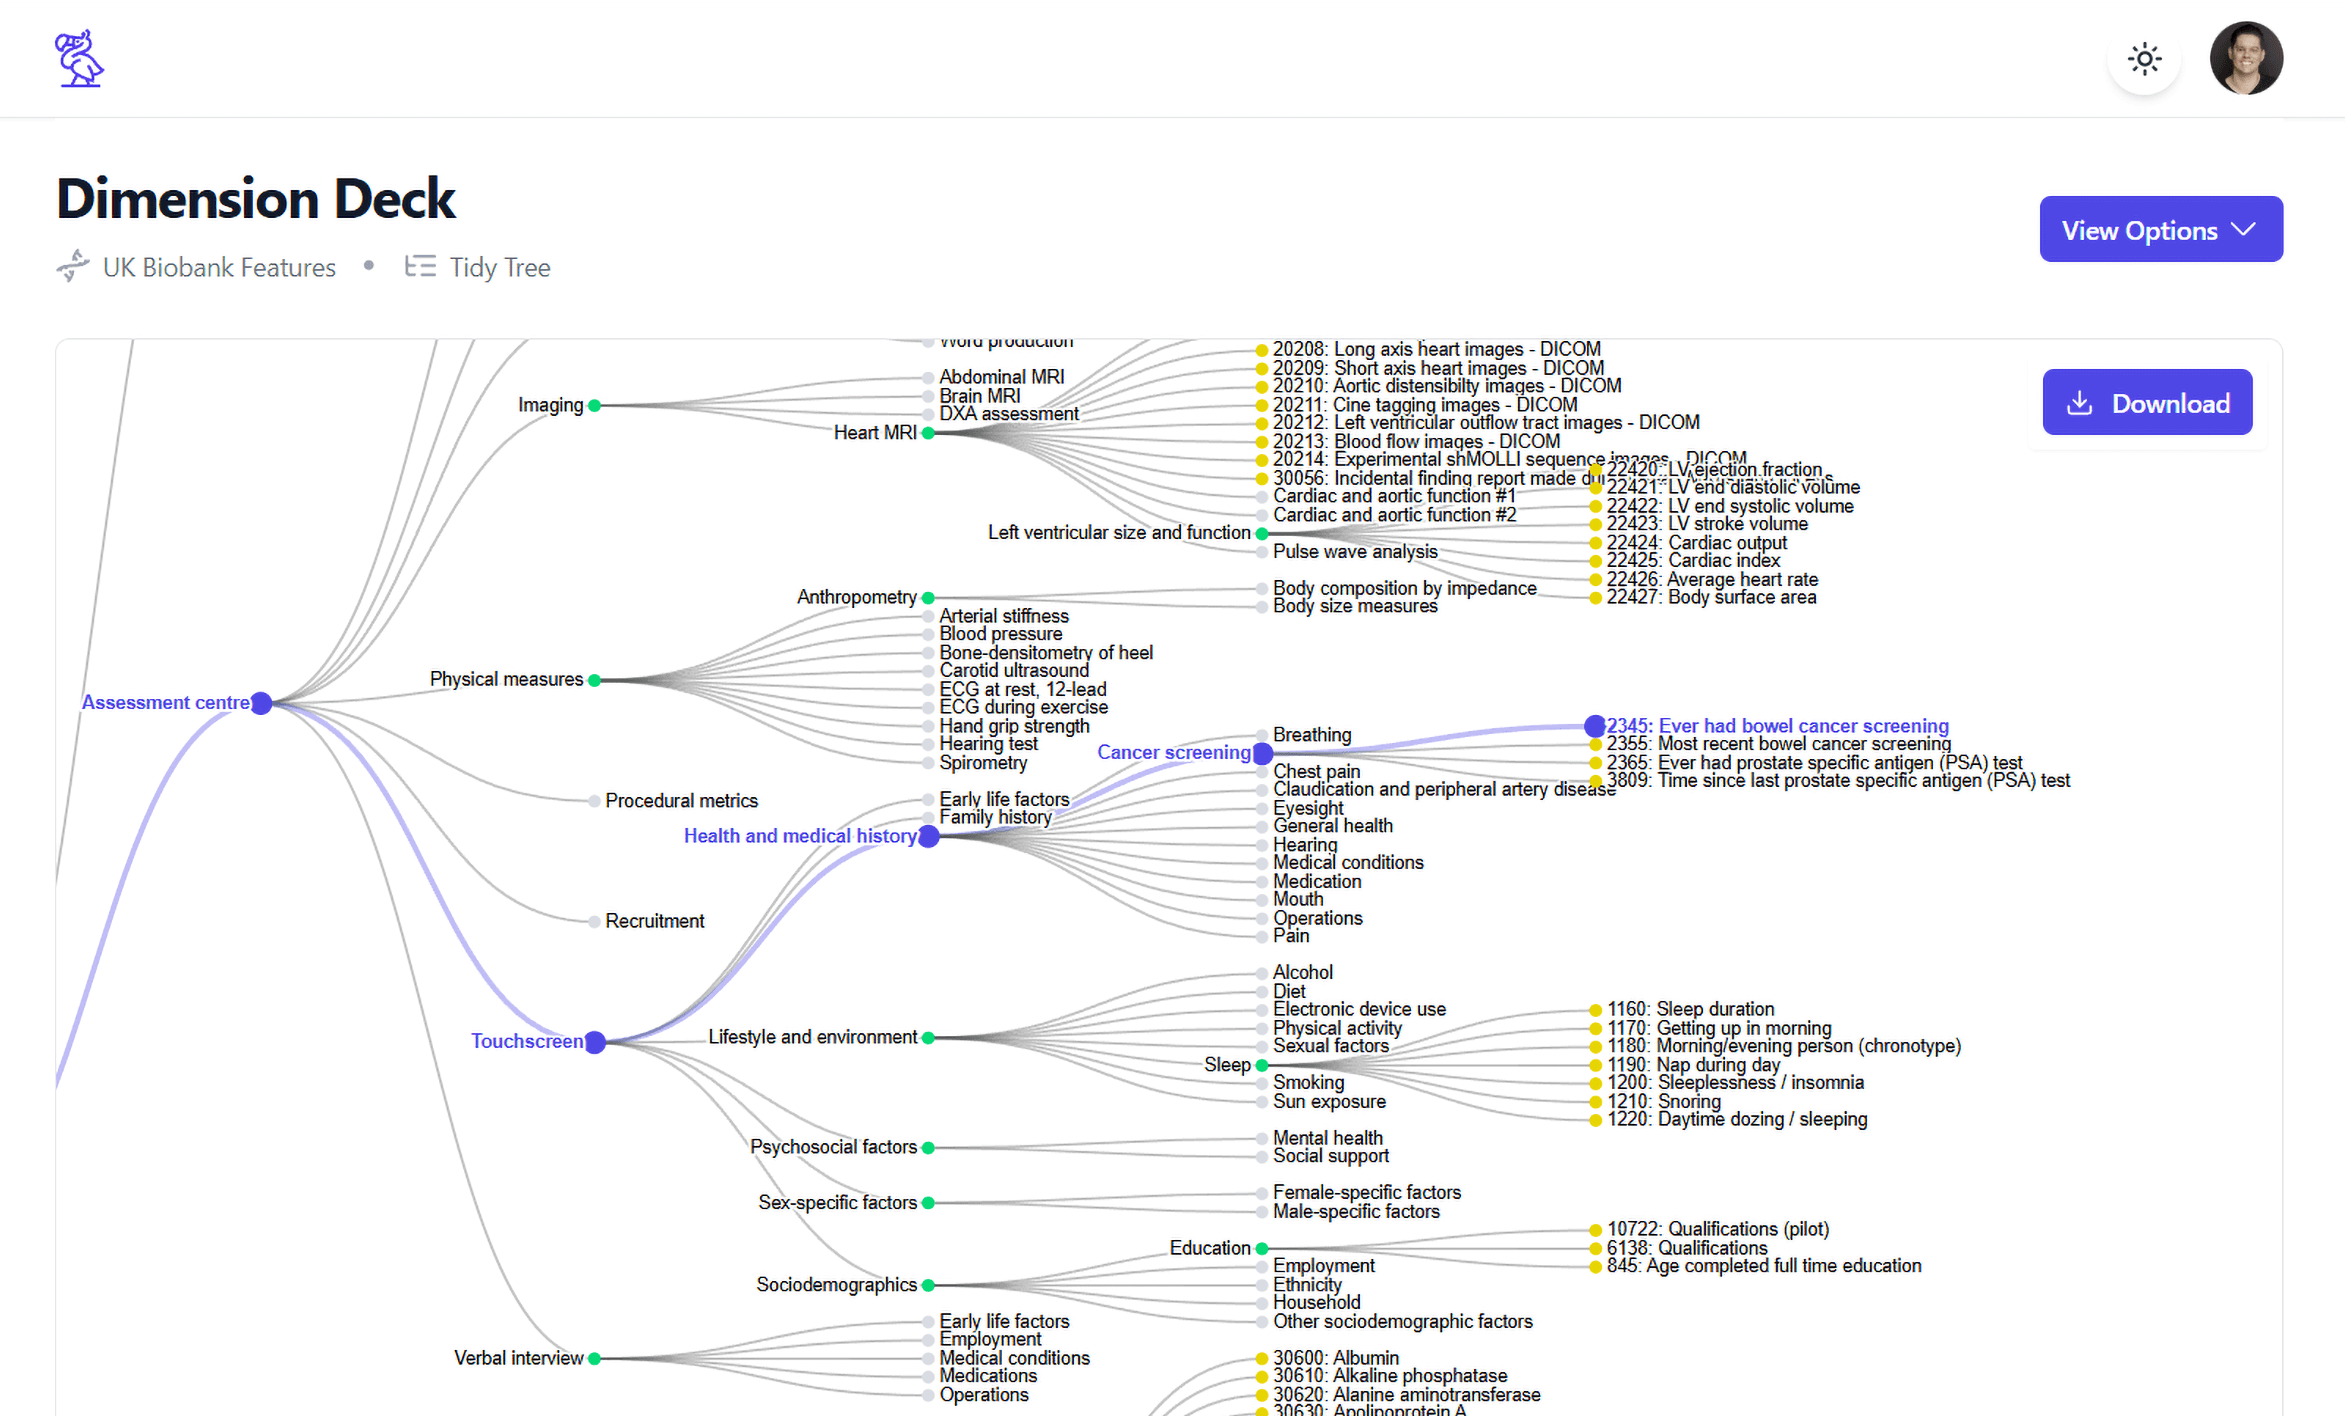
- Navigate phenotype clusters.
- Explore specific segments of the UK Biobank dataset with precision. Seamlessly zoom into phenotype groupings to uncover meaningful patterns.
- Export key insights.
- Select and export nodes, edges, or entire views for offline analysis or integration with your research pipeline.
- Generate high-level summaries.
- View automatically generated phenotype insights to quickly understand group dynamics and outliers within the dataset.